work
Assignment 3
Methodological Investigation
Yunki Lee
Introduction
Poverty is a problem faced globally whether it is in highly developed regions or non-developed regions. Due to the circumstances of today’s world, many people face poverty due to the economy, social classes, or environment around them. The most restricting characteristic of poverty is the income of individuals. In fact studies show that nearly half of the world’s population lives on two dollars and fifty cents a day. Another shows that a 1.3 billion people of the global population face extreme poverty which is less than a dollar and twenty five cents a day.
Poverty is described as living conditions that are detrimental to health, economic development, and comfort. There are different forms and levels of poverty. Poverty is extremely harmful because it can lead to higher infant mortality, shorter life spans, lower literacy, environmental degradation, and the loss of biodiversity. Poverty threatens human development and overall well-being globally.
Amartya Sen defines human development as the process of expanding the real freedoms that people enjoy. Poverty is a threat to human development due to its restrictions on individuals. It does not allow people to enjoy the real freedoms due to economic, social, and sometimes even environmental factors. In order for regions to develop, threats such as poverty must be reduced or removed. One step in the right direction is the prediction of poverty in regions. One area that specifically faces high poverty levels is Southeast Asia as it is still a developing region. Through recent studies it has shown to be extremely difficult to predict poverty in a large region. Studies show that poverty prediction can be done on smaller areas through the use of geospatial data. I wish to investigate poverty prediction in the Philippines.
Inquiry
The research question is an evaluative inquiry as it is examining the effectiveness of geospatial data methods in predicting poverty. The research question I wish to answer is: Is poverty prediction an accurate way to combat poverty in the Philippines? This research question dives deeper into the Philippines which is a country within Southeast Asia. It evaluates the effectiveness of poverty prediction. If the poverty prediction is effective, it can result in the reduction of poverty in the area.
Data Collection
The data used for the prediction of poverty in the Philippines came from five different data sources. All the data sources are reliable and have been used by many different studies. The data sources are the 2017 Philippine Demographic and Health Survey (DHS), the Visible Infrared Imaging Radiometer Suite Day/Night Band (VIIRSDNB) for the year 2016, The High Resolution Settlement Layer dataset, and OpenStreetMap.
The data used in the study are in the table below.
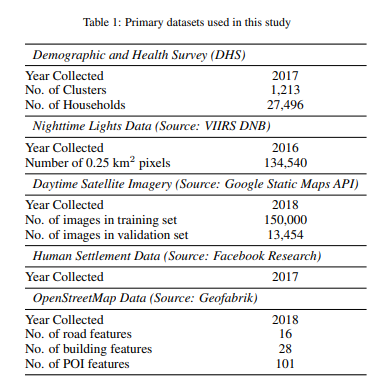
Through the data the researchers focused on wealth index, education completed, access to electricity, and access to water. These four datasets are captured by the DHS and are used to create data by the researchers.
Methods
The geospatial methods used were a combination of crowd-sourced geospatial data and satellite data. The specific methods used to evaluate the data were the Satellite-based Transfer Learning Model and the OpenStreetMap Model. Both models were also evaluated using a five-fold nested cross validation scheme.
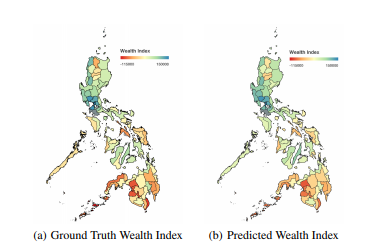
The Satellite-based Transfer Learning Model involves the use of nighttime lights as an assumption of economic activity. They classified the data with five night time intensity classes. Their data had to be converted down to 224x224 pixel images from 400x400 pixel images, and so they did their best to adjust them. Then, they used images to create clusters of up to 400 images that featured vectors. Through the ridge regression model, they were able to use a ridge regression model to learn mapping from the clusters. Through the Satellite-based Transfer Learning Model, the researchers were able to create a map showing the wealth index across the Philippines.
The OpenStreetModel used clusters to extract roads, buildings, and points of interest. Five types of roads were identified, these were primary, trunk, paved, unpaved, and intersection. For the roads they calculated the distance to the closest road, the total number of roads, and the total road length per cluster. Then, six different buildings were identified, these included residential, damaged, commercial, industrial, education, and health. For every type of building the total number, total area, mean area, and the proportion of cluster area occupied were found. For the POIs, 100 different points were found. For each cluster they found the total number of POI’s in the area. The socioeconomic well-being was predicted through the comparison of the performances of random forest regression models trained on the different types of OpenStreetModel features. Specifically OpenStreetModel and nighttime light data were used in combinations to train random forest regression models.
Both these methods are extremely accurate in predicting poverty. This is found through results of poverty prediction.
The ground-truth wealth index can be seen next to the predicted wealth index below.
The crowd-sourced geospatial data was used to create the poverty prediction models. Below are the ground-truth wealth index and cross-validated Philippine poverty predictions using each model.
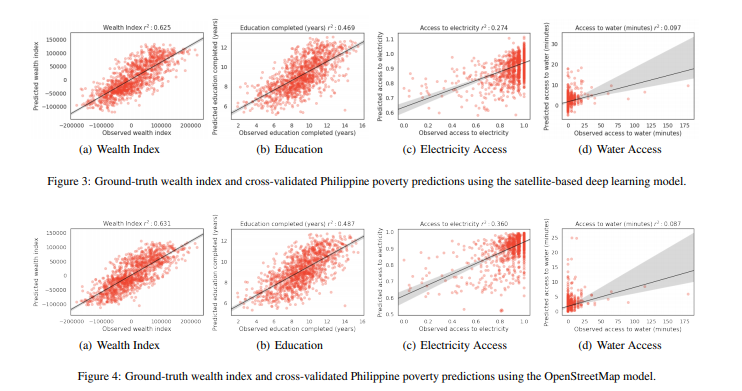
Through these geospatial data methods, poverty was able to be accurately predicted in the Philippines.
Discussion and Conclusion
The results of the study on the prediction of poverty through geospatial data methods resulted in the confirmation of the applicability of the method. The study also showed that the method can not be exactly copied for another country due to the geography of the Philippines. The results have also shown that poverty prediction can be done through free and public crowd-sourced geospatial information. These results have been validated through the comparison in other predictive models. Other predictive models were analyzed and resulted in r-squared values from 0.51 to 0.75. The r-squared value for the Philippine predictions were both .63. As a result the predictions are fairly accurate. This is possible due to the DHS which measures the ground truth for the socioeconomic indicators, and the Philippine Statistical Authority which collects national social, economic, and health-related data. I can conclude that the prediction of poverty in the Philippines is fairly accurate.
An area of this research that needs further consideration would be the application to other countries in Southeast Asia. Although it states that the methods would not work on other countries due to the geography of the Philippines. I feel that further research could have been done to possibly create a model that can be somewhat used in other countries. An improvement to the study could also be to do further testing to get a higher r-squared value to increase the accuracy of the poverty prediction.